The requirement to perform regular Product Quality Reviews (PQRs) is mandated in most codes of Good Manufacturing Practice. For most of these, the frequency of these reviews is to be at least annually.
The intent of these reviews is to perform and internal audit on all facets of the manufacturing, storage and use of the products.
Due to the scope of the processes involved (receival, storage, manufacture, testing, non-onformances, deviations, CAPAs, changes, complaints, recalls) as well as the entities involved (sponsors, vendors, materials, personnel, customers, documents), data is required from many sources and systems.
Obviously, the results from the review (if performed correctly), provide either evidence that a product is consistently being manufactured under control or areas that need to be addressed to bring the process back under control.

Figure 0 - Statistical Process Control Chart representation
For this reason, it would be preferable if this review occurred far more often than just yearly. Unfortunately, for most companies, the PQR is a manual, time-consuming exercise extracting data from multiple systems and collating it into a reportable form.
As the format of this data is variable (database, spreadsheets, paper, etc), no single system exists to specifically perform the PQR.
By using a data analytics tool, data can be imported from many sources to a central area, logically connected together and then charted and reporting on as required.
Although not the only option, Microsoft Power BI is gaining traction amongst many companies as a data visualisation tool.
Being a Microsoft product, it has a similar look and feel to Excel and Access.
Although Figure 1 looks very complex, the task of loading the data is quite simple. The system itself attempts to connect the data automatically based on column names.
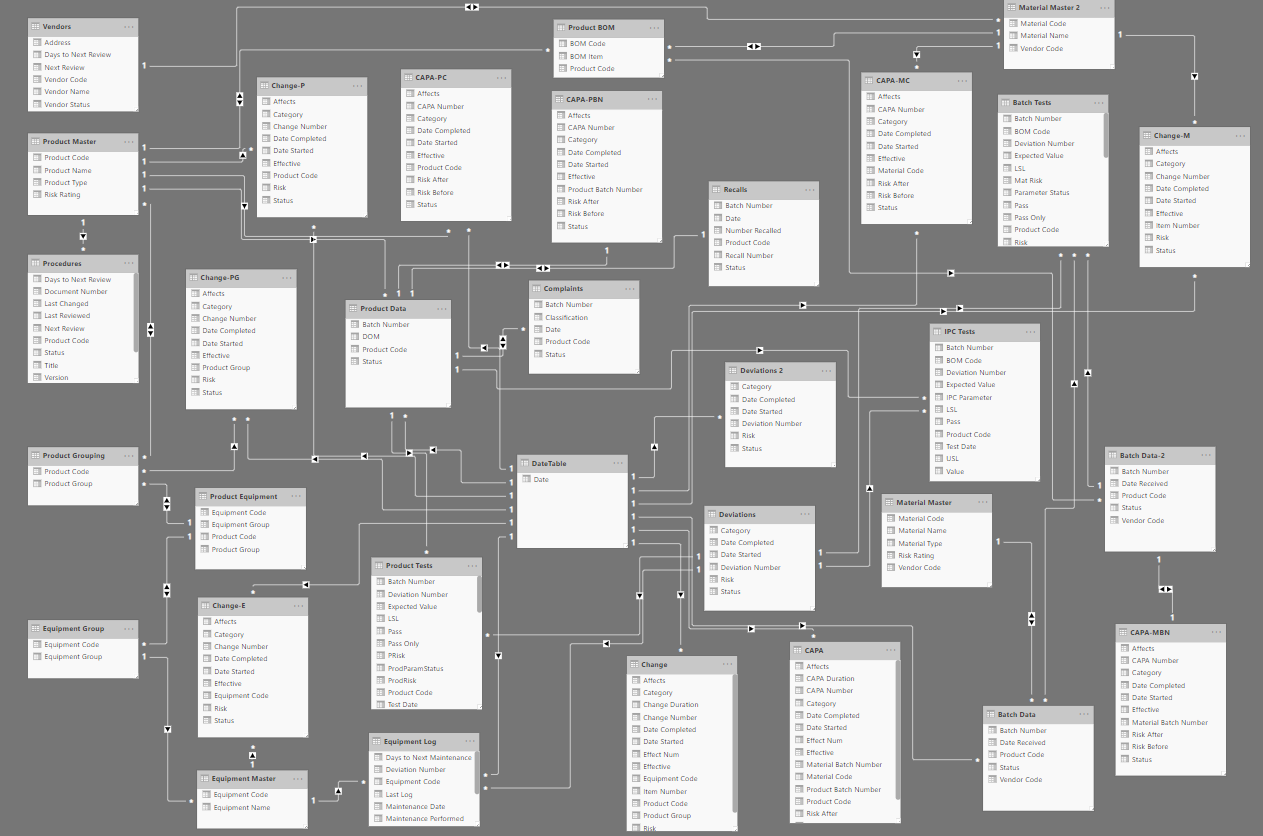
Figure 1 - Data Relationships
Once the data is imported, tables can be split or joined together, additional columns can be added (Figure 2) or data measures (calculations across subsets of data) created.
All original data, new columns and measures can be used in the charting and reporting.
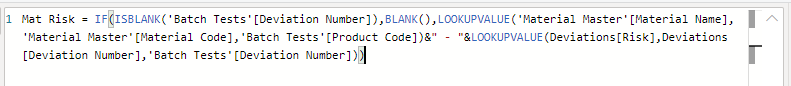
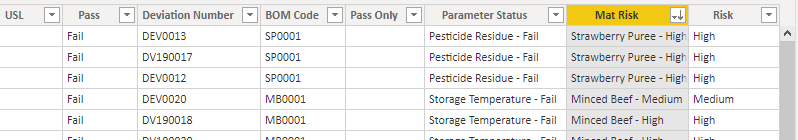
Figure 2 - Additional column ‘Mat Risk’ created
Once the data is partitioned correctly (i.e. by year, by product group, by product, by starting material, by test parameter, by equipment group, etc), ‘visualizations’ can be created to display the data.
Figure 3 is an example header page showing yearly summary data for 3 products across 2 years.
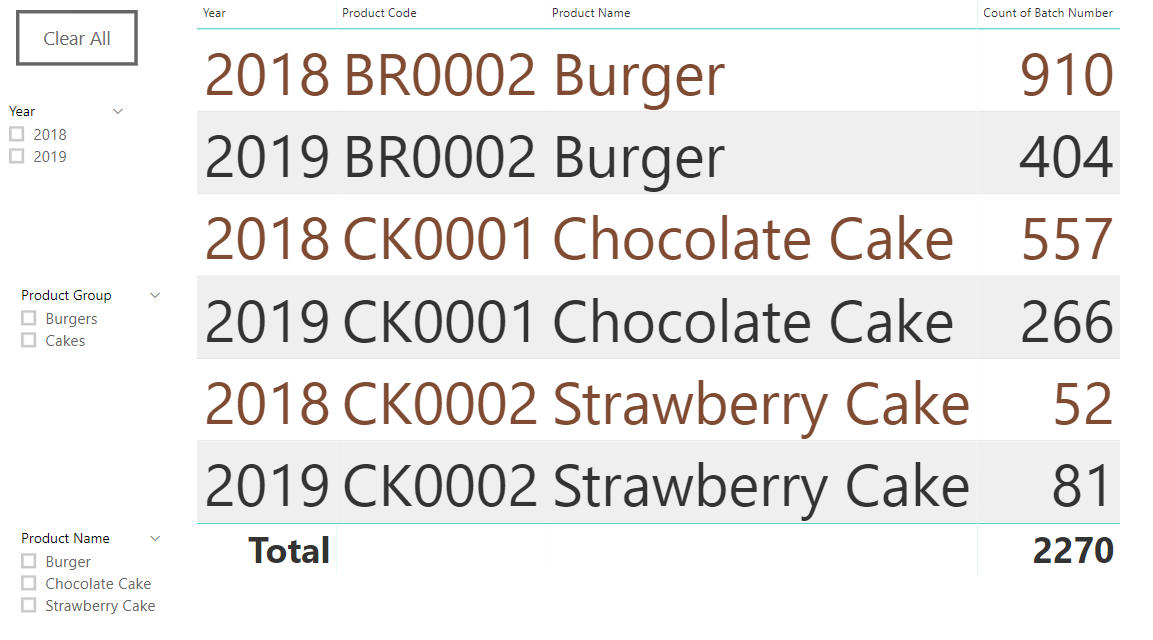 Figure 3 - Report allowing data selection by year, Product Group and/or Product
Data ‘slicers’ may be applied to the current page report or shared across multiple pages. For example, if ‘2018’ and ‘Chocolate Cake’ is selected on the header page then only the BOM materials for that (and subsequent raw material status results and deviation risks) are shown on the Starting Materials page (Figure 4).
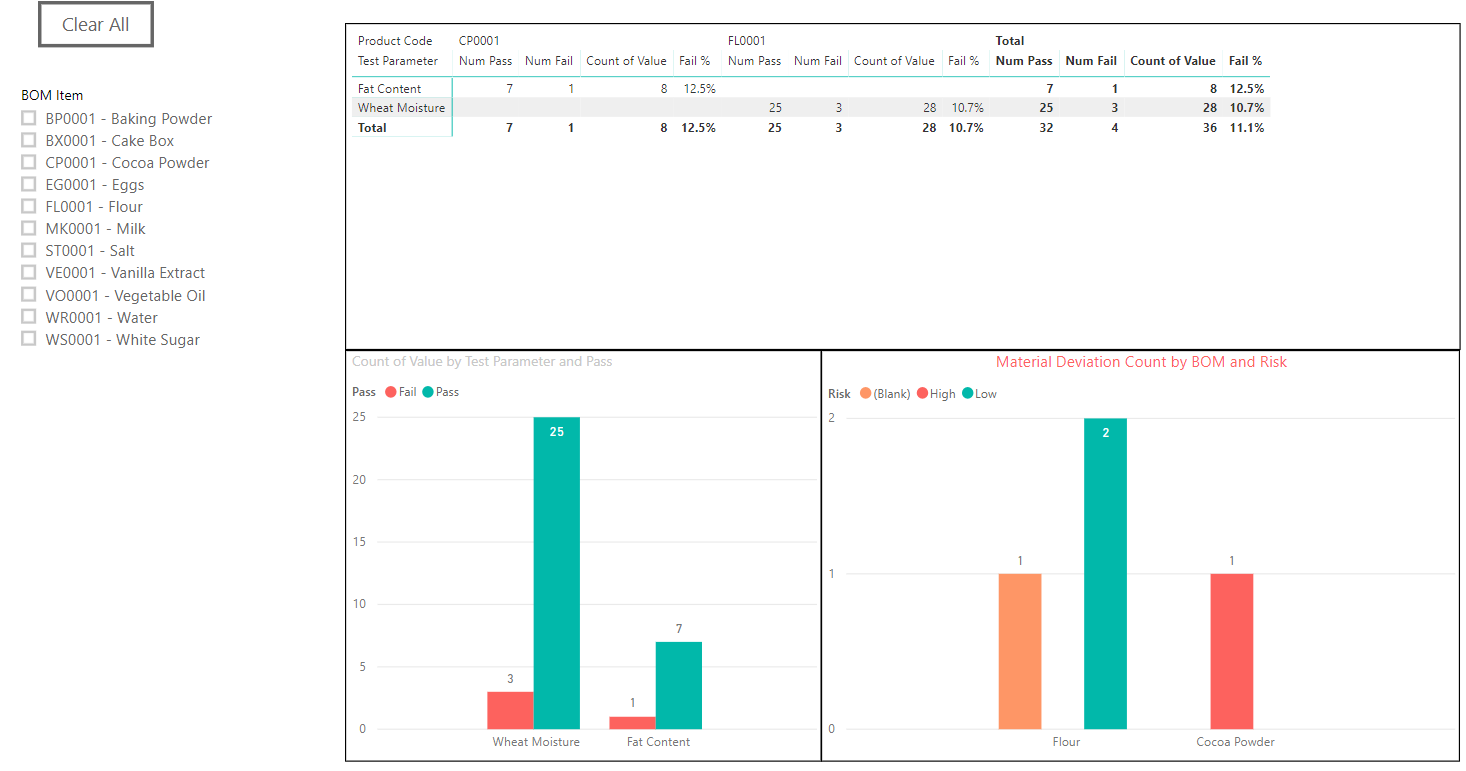
Figure 4 - Restricted starting materials data
Control charts for in-process control tests (Figure 5) as well as finished product results and process capability (CpK) (Figure 6) can be calculated and reported.
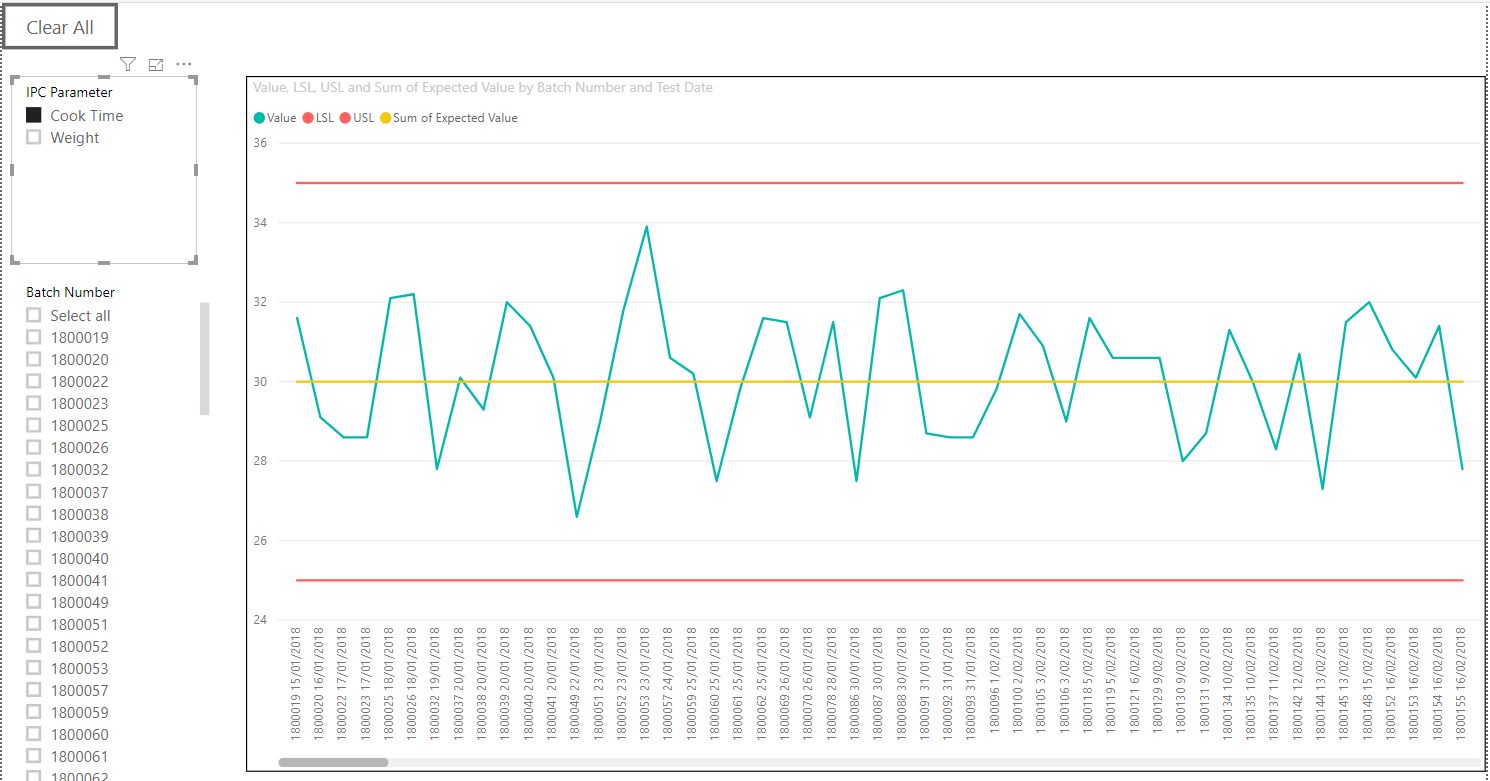
Figure 5 - In-process control testing results
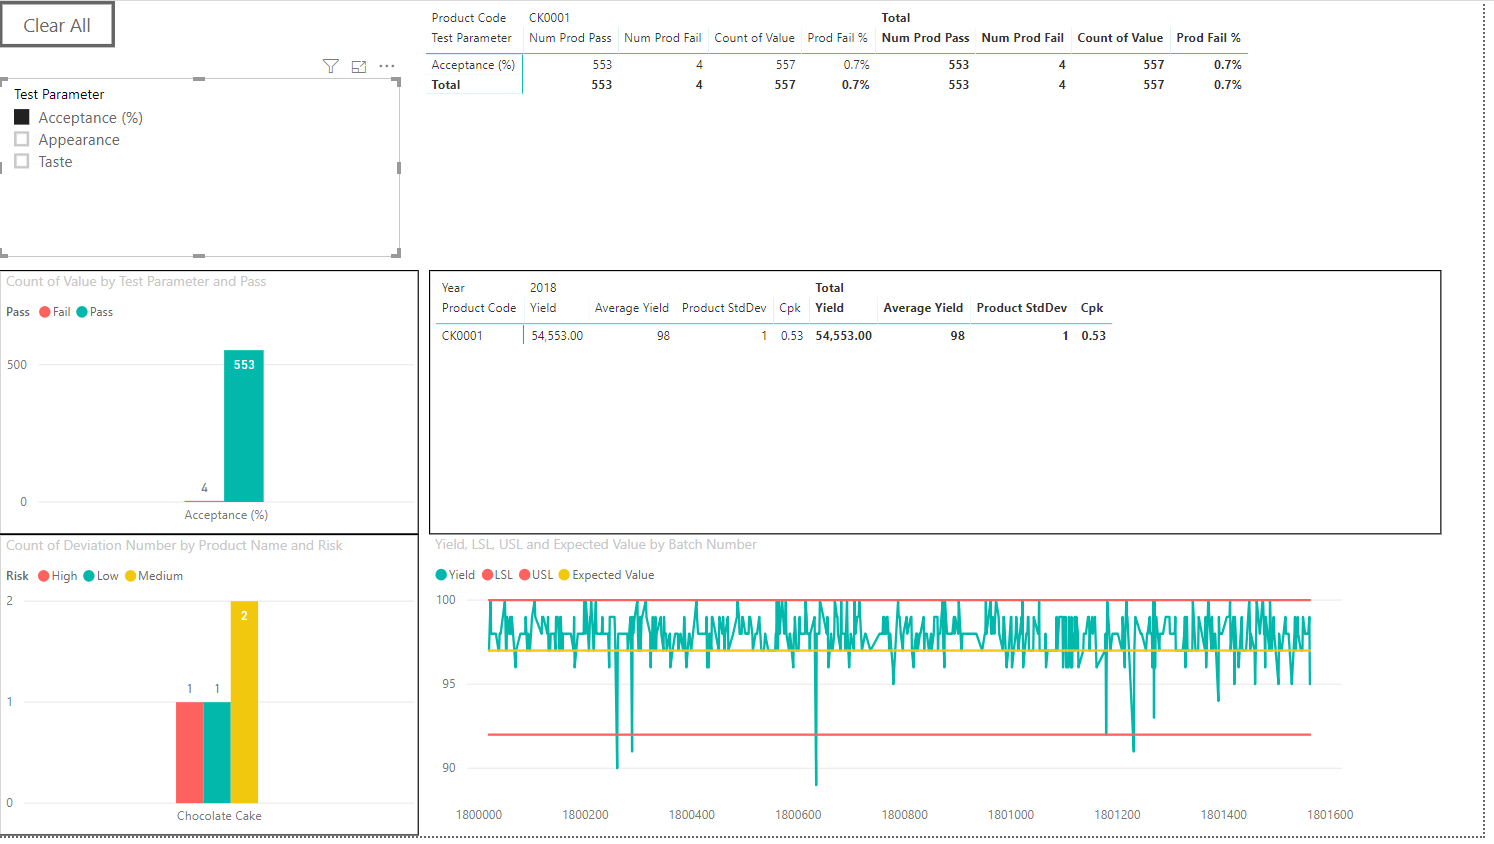
Figure 6 - Finished product results and process capability (CpK)
Additional report pages can be defined to:
- compare yearly data (on both raw material and products),
- confirm vendor status,
- report on failed batches,
- report on deviation / CAPA / non-conformance data by material and product,
- report on changes by material, product, product group and equipment group,
- report on complaints by complaint category and compare this to resolution category,
- report on recalls,
- report on equipment calibration and maintenance,
- report on relevant documents, labels, agreements and marketing claims
With the output from the reports, a PQR starting report can be created. Justifications, reasonings and PQR wording needs to be added to complete the actual report.
As data can be configured to be auto loaded into Power BI (using a gateway to the source data), or manually updated as required, the data analysis can be performed more frequently than with a manually created PQR. As with other forms of audits, corrective actions and changes can be created as a result of knowledge learnt from the process.
In summary, Microsoft’s Power BI can be configured to provide the framework to provide continual review of products and processes.
However, as with any automated system used as part of a GxP process, the solution needs to be carefully planned, and the data structured and loaded in a way that supports the output required.
Contact us if you’d like to learn more about how Microsoft Power BI can help with managing your Product Quality Reviews (PQRs).